Spreadsheet suffering to success
A patent-filed financial forecasting product, built by a team that hadn’t shipped anything new in seven years.
What this was
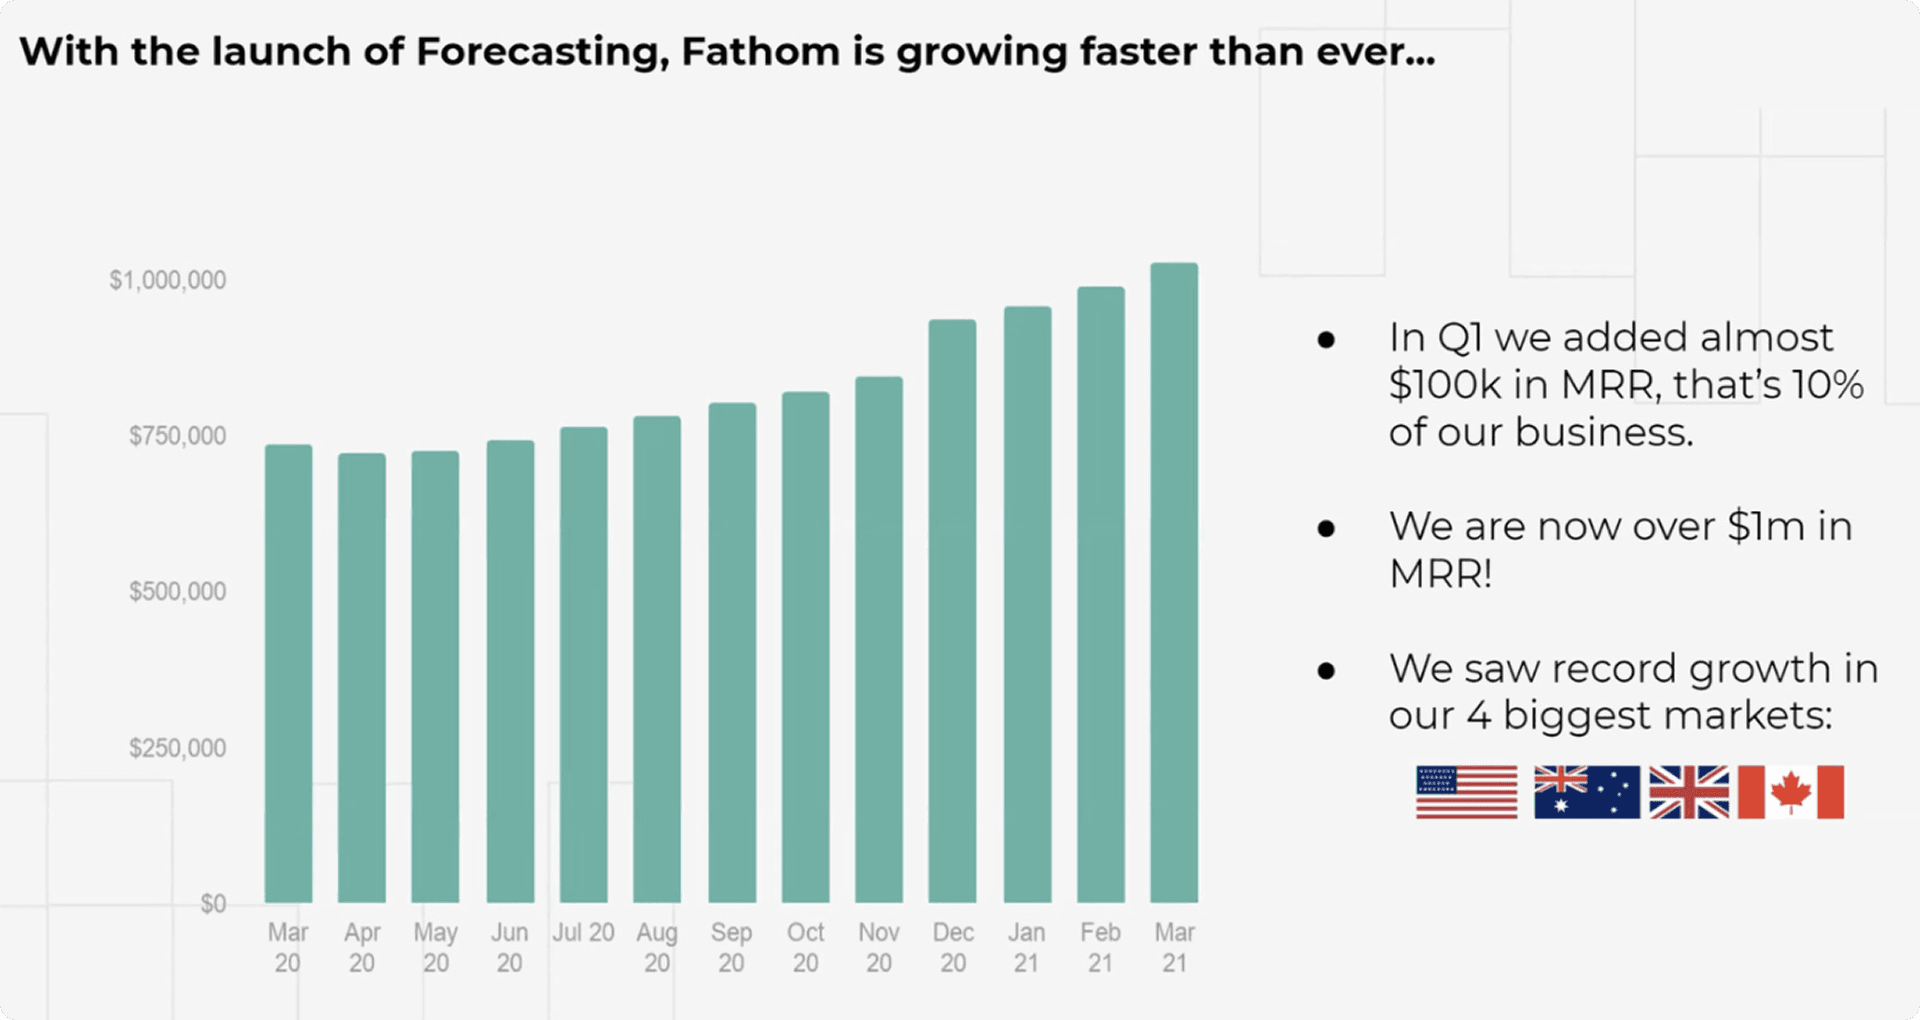
Fathom hadn’t shipped a new product in seven years. Forecasting was the bet that broke the streak. The team launched in 2021, added $100k MRR in Q1, drove a 46% month-over-month increase in new customer revenue, and Fathom filed an international patent on the forecasting system.
That part is the highlight reel. The actual story is more interesting and more honest: we walked into a perfect storm of organisational risk, market saturation, and subject matter that nobody on the team fully understood. Then we shipped anyway.
Forecasting was led by Fathom’s Head of Product. I was Senior Product Designer on the team across the full lifecycle.
When everything aligns against you
When I first heard "financial forecasting," I assumed we were heading into a world of spreadsheets and calculator pain. I was right. But I underestimated everything else.
Organisationally, Fathom was set up for feature delivery, not new product development. After seven years without launching anything new, the muscle memory was gone. Leadership was brilliant but uncertain about modern product processes. Engineering worked in silos. The culture was risk-averse in a way that had served the business well, until now.
Commercially, we were entering a crowded category where competitors had mature feature sets. The good news, which only became visible through research, was that the real competition wasn’t a competitor product. It was Excel. Every business owner we spoke to was wrestling with brittle, error-prone spreadsheets that made financial projections nearly impossible to share, audit, or trust.
Technically and conceptually, three-way forecasting (P&L, Balance Sheet, Cash Flow) requires sophisticated accounting knowledge. Mid-project we lost a designer and gained two new team members and a second product designer who needed to learn the entire domain quickly. I became (one of) the key sources of truth for the team, helping onboard while still doing the design work.
This is the bit case studies usually skip. The fun part is the design solution. The actual job was holding the room together long enough for the design solution to matter.

What my role was
Title was Senior Product Designer. The work sat within that role honestly but leaned into the places a small NPD bet needs a senior designer to lean.
Senior Product Designer across discovery, concept, and delivery. Partner to the product lead on design craft and interaction problems as they surfaced. Domain educator as the team rotated and new designers and BAs joined mid-project and needed to be brought up to speed on three-way forecasting fast. Research participant across the customer engagement program. Delivery contributor, writing tickets, stress-testing features, pairing with engineers on the harder interaction details.
At a small company building a hard product, the boundaries blur. I stopped pretending they didn’t, while keeping clear about who owned what.
At a small company building a hard product, the boundaries blur. I stopped pretending they didn’t.
Building confidence through alignment
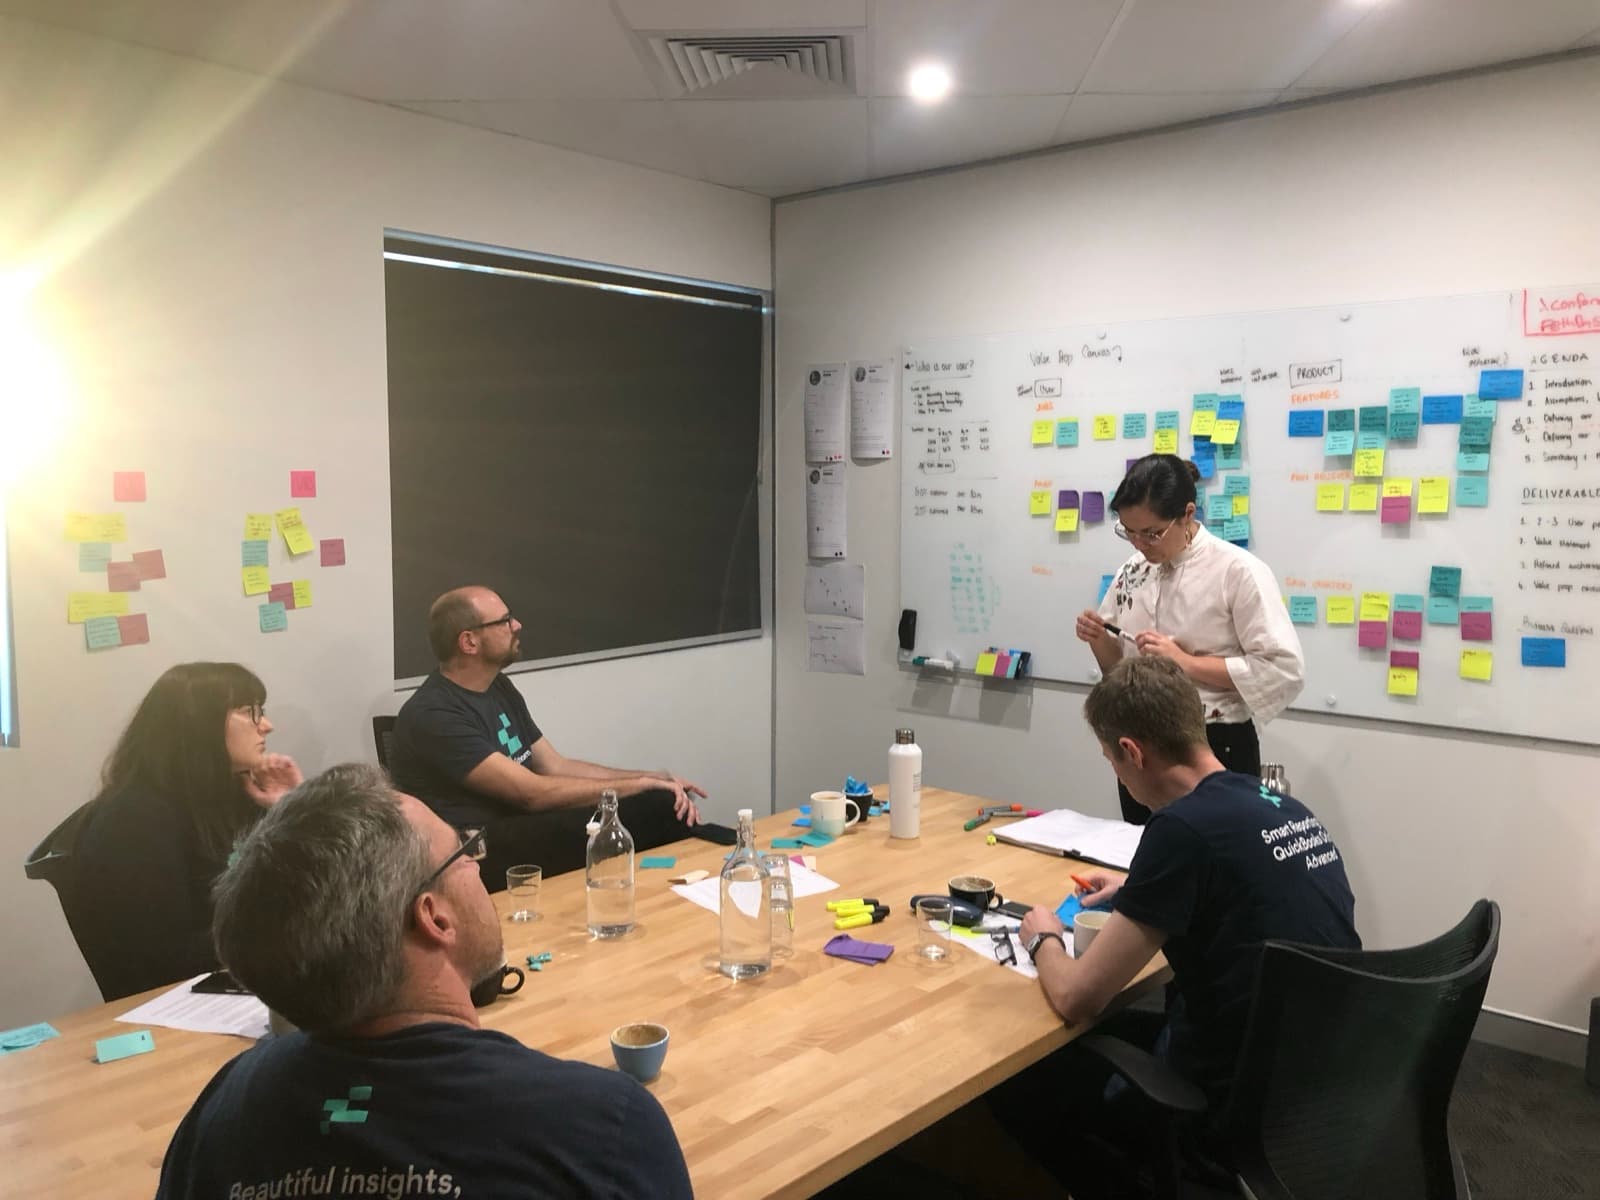
The first move wasn’t a design decision. The product lead ran a vision workshop with the founders to agree on what we were actually trying to do. Out of that, four guiding principles became the team's north star, each one framed as a direct rejection of how forecasting tools worked at the time. These weren’t slogans. They became the test the team ran every design and engineering decision against. When something failed any of the four, it didn’t ship.
From frustration to pillar
The four principles that became the decision filter.
- Time intensive to createEfficient to build and maintain
- Depreciates quicklyAdaptive and always relevant
- Hard to decipherAuditable and transparent
- Difficult to communicateApproachable and actionable
Research as the real differentiator
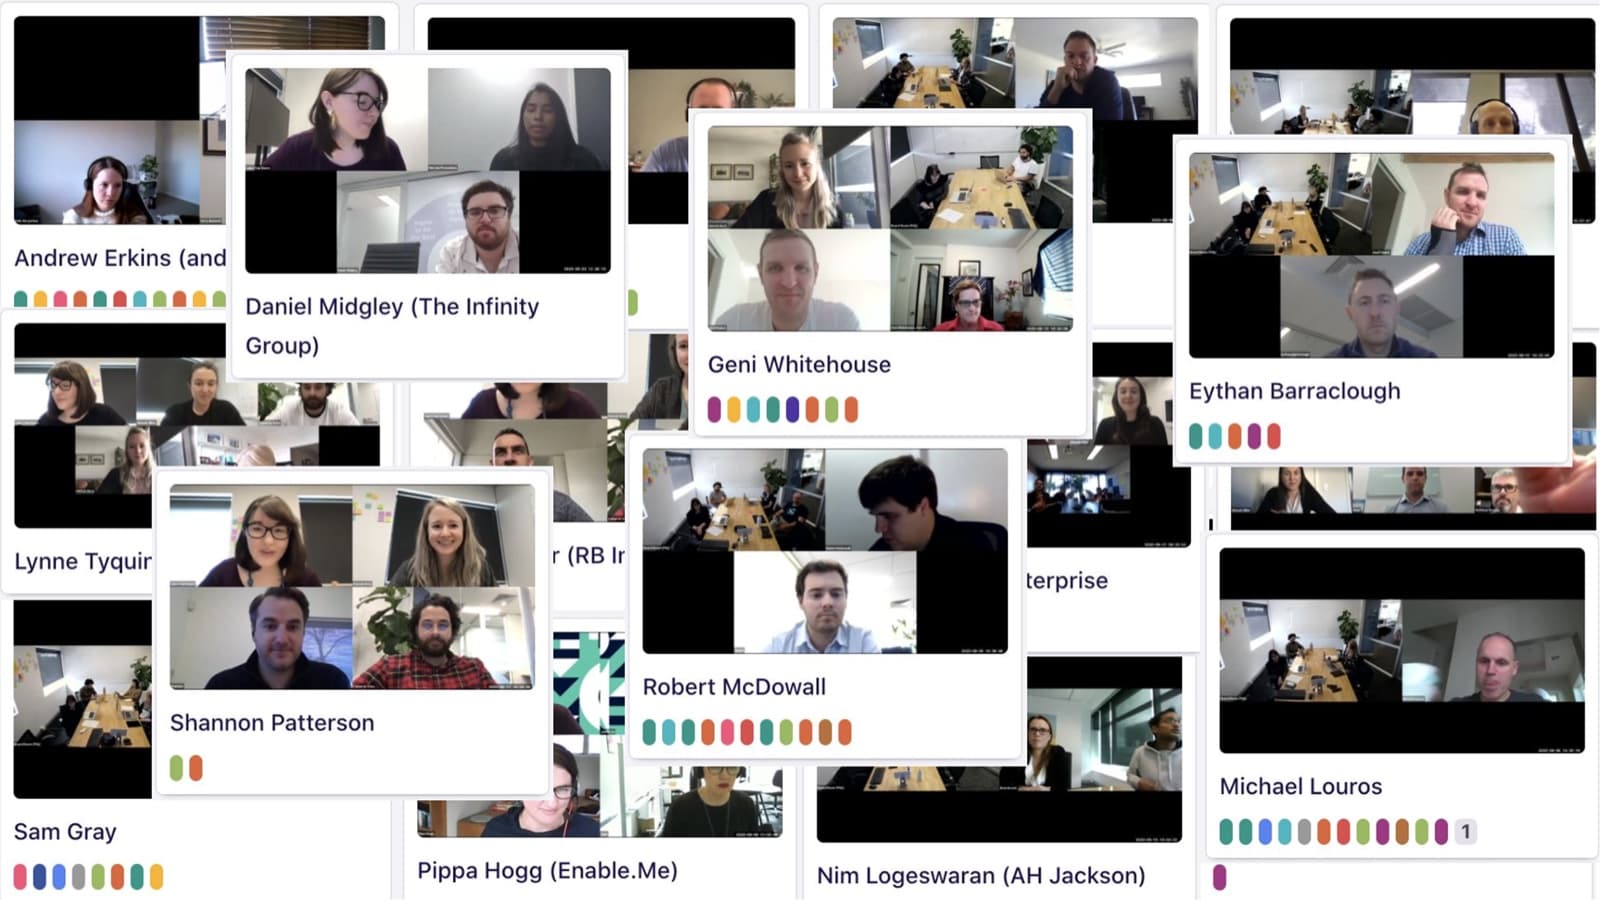
Competitors weren’t investing in research. The team did, and it became the lever that moved the strategy. I participated across the phases and ran synthesis with the team.
Across the project, the team ran seven phases of research: 76 customer interviews, surveys spanning over 1,100 respondents, and synthesis of support interactions for adjacent insight. Participants spanned business owners, CFOs, financial controllers, self-employed advisors, small and mid-tier firms, and large consultancies across a wide turnover range.
The headline finding was simple and useful. Creating a forecast in Excel took an average of nine hours. Once built, the relevancy of that forecast started decaying within months. Nobody trusted the numbers because nobody could see where they came from.
The deeper finding was less obvious. Forecasting wasn’t a numbers problem. It was a communication problem. Owners needed to share projections with advisors, partners, and investors. The tools made that nearly impossible.
That reframe changed everything the team built next.
Forecasting wasn’t a numbers problem. It was a communication problem.
What we shipped
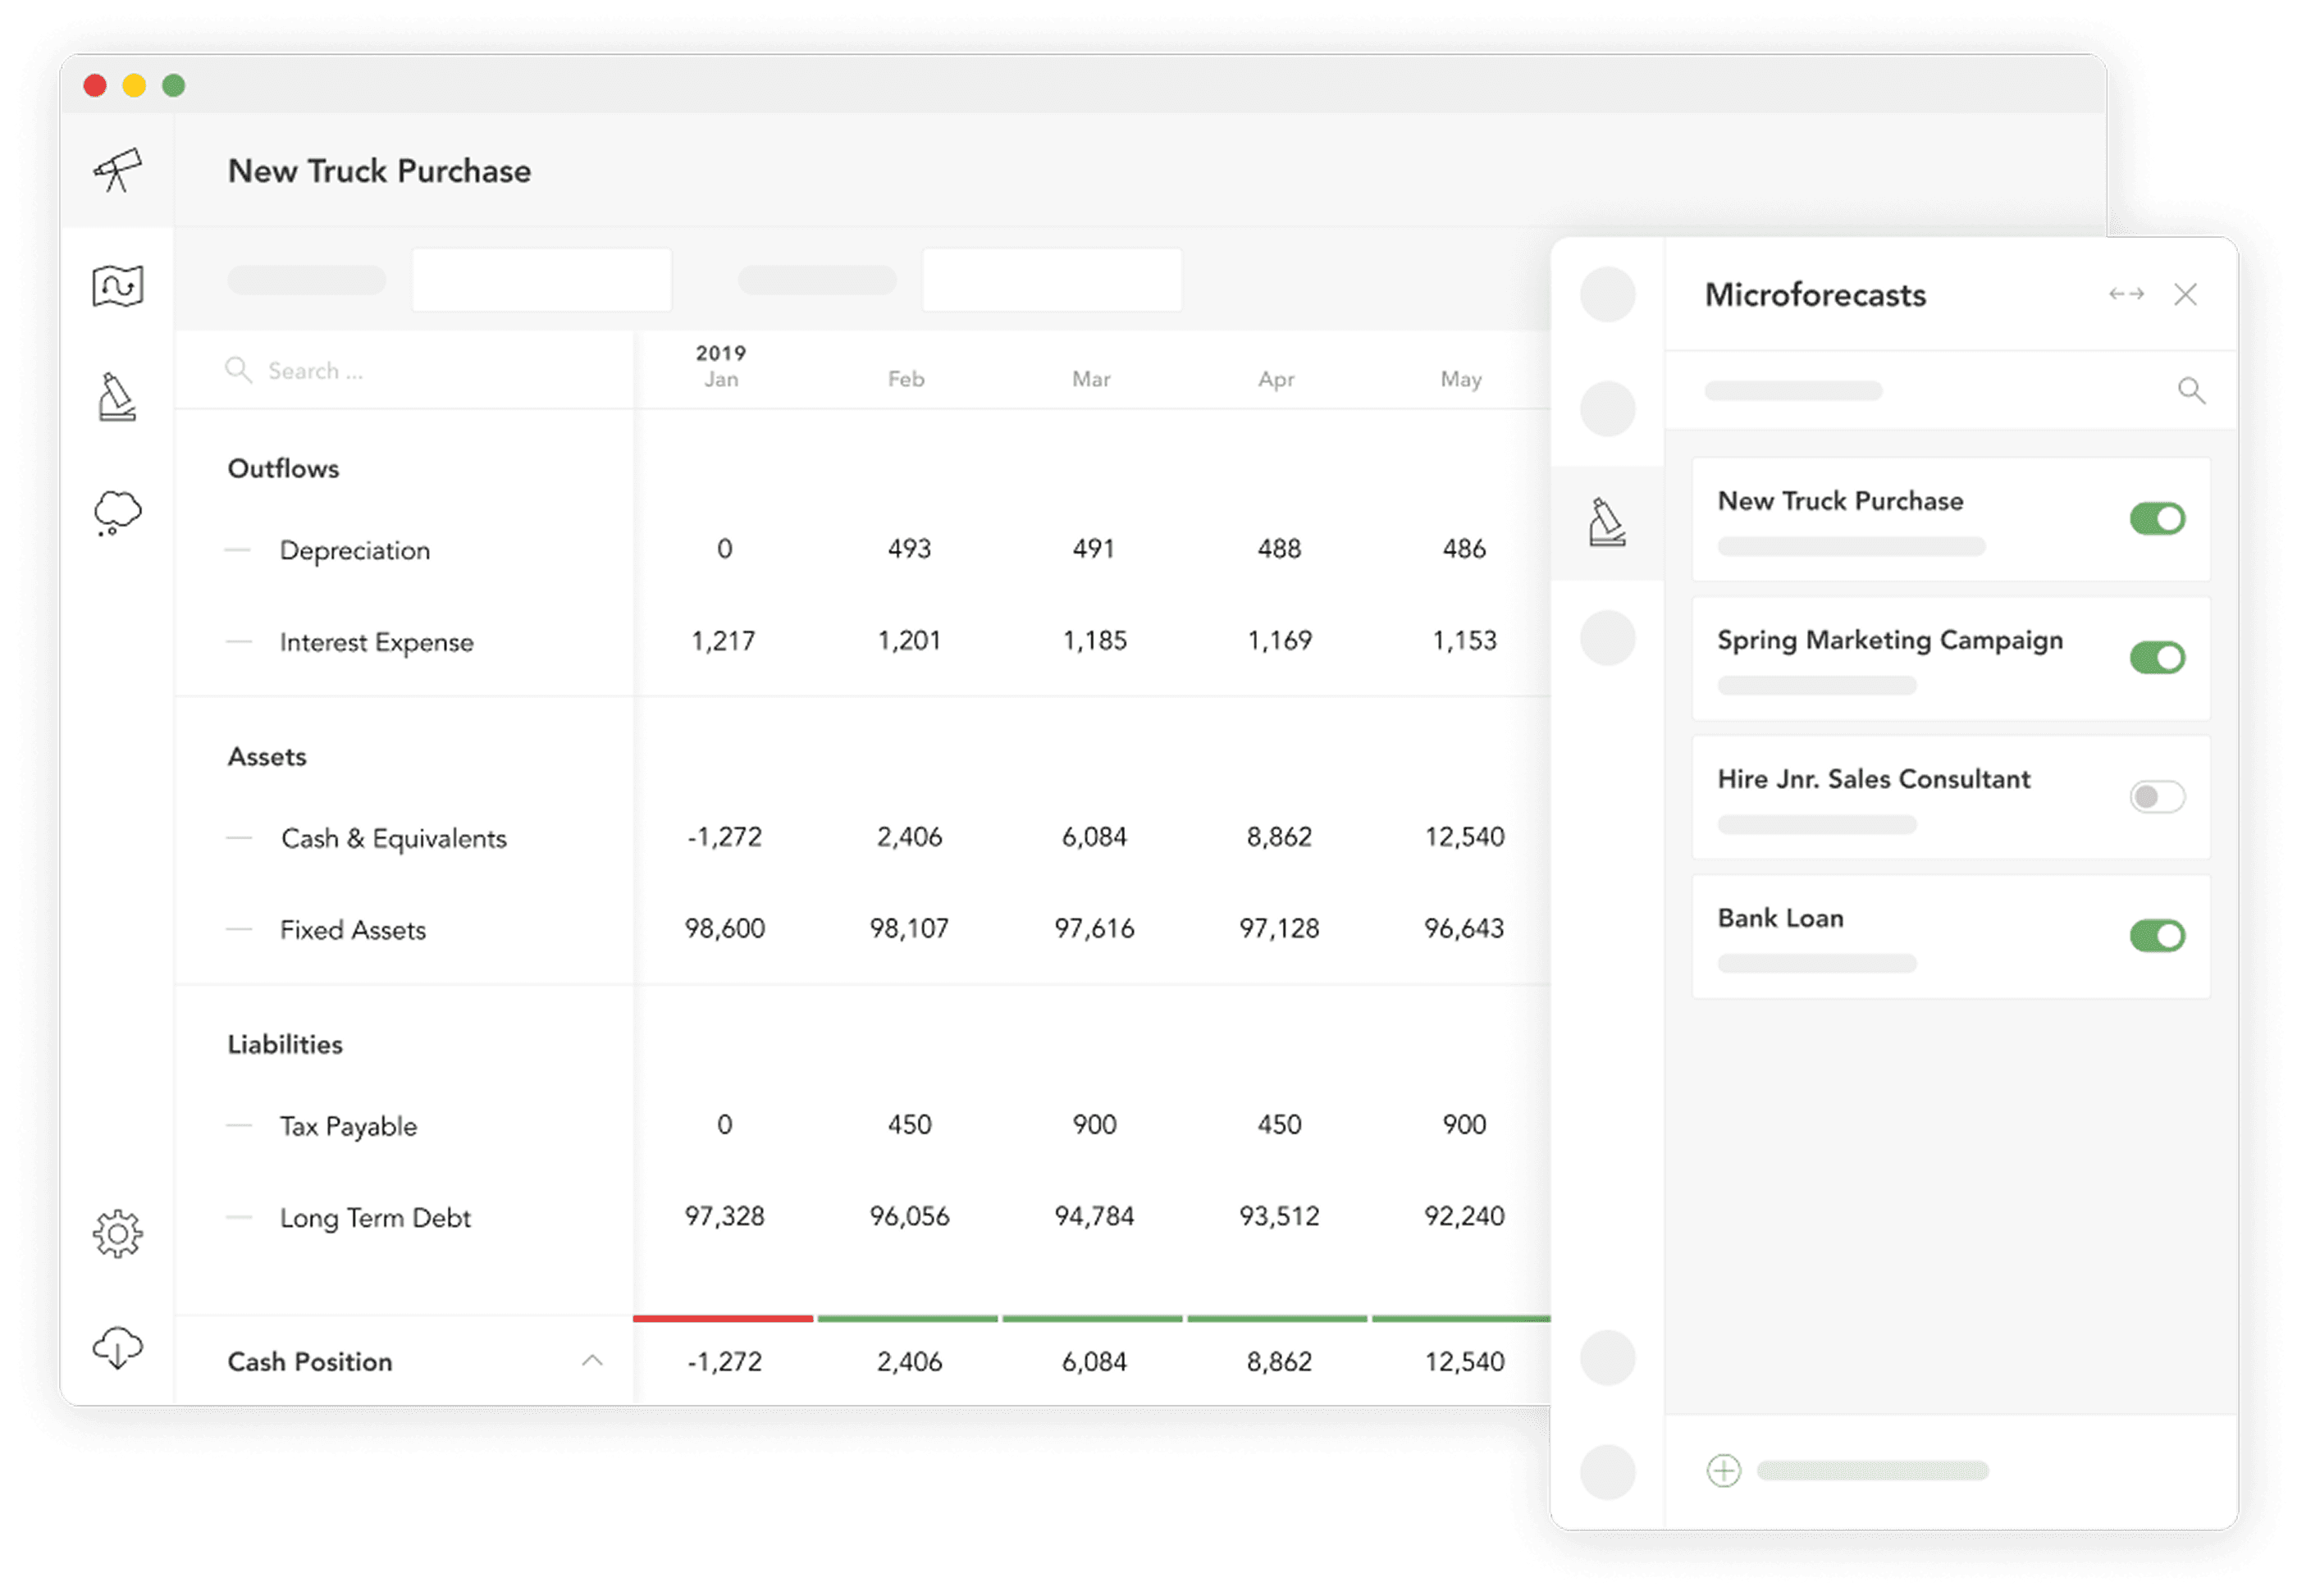
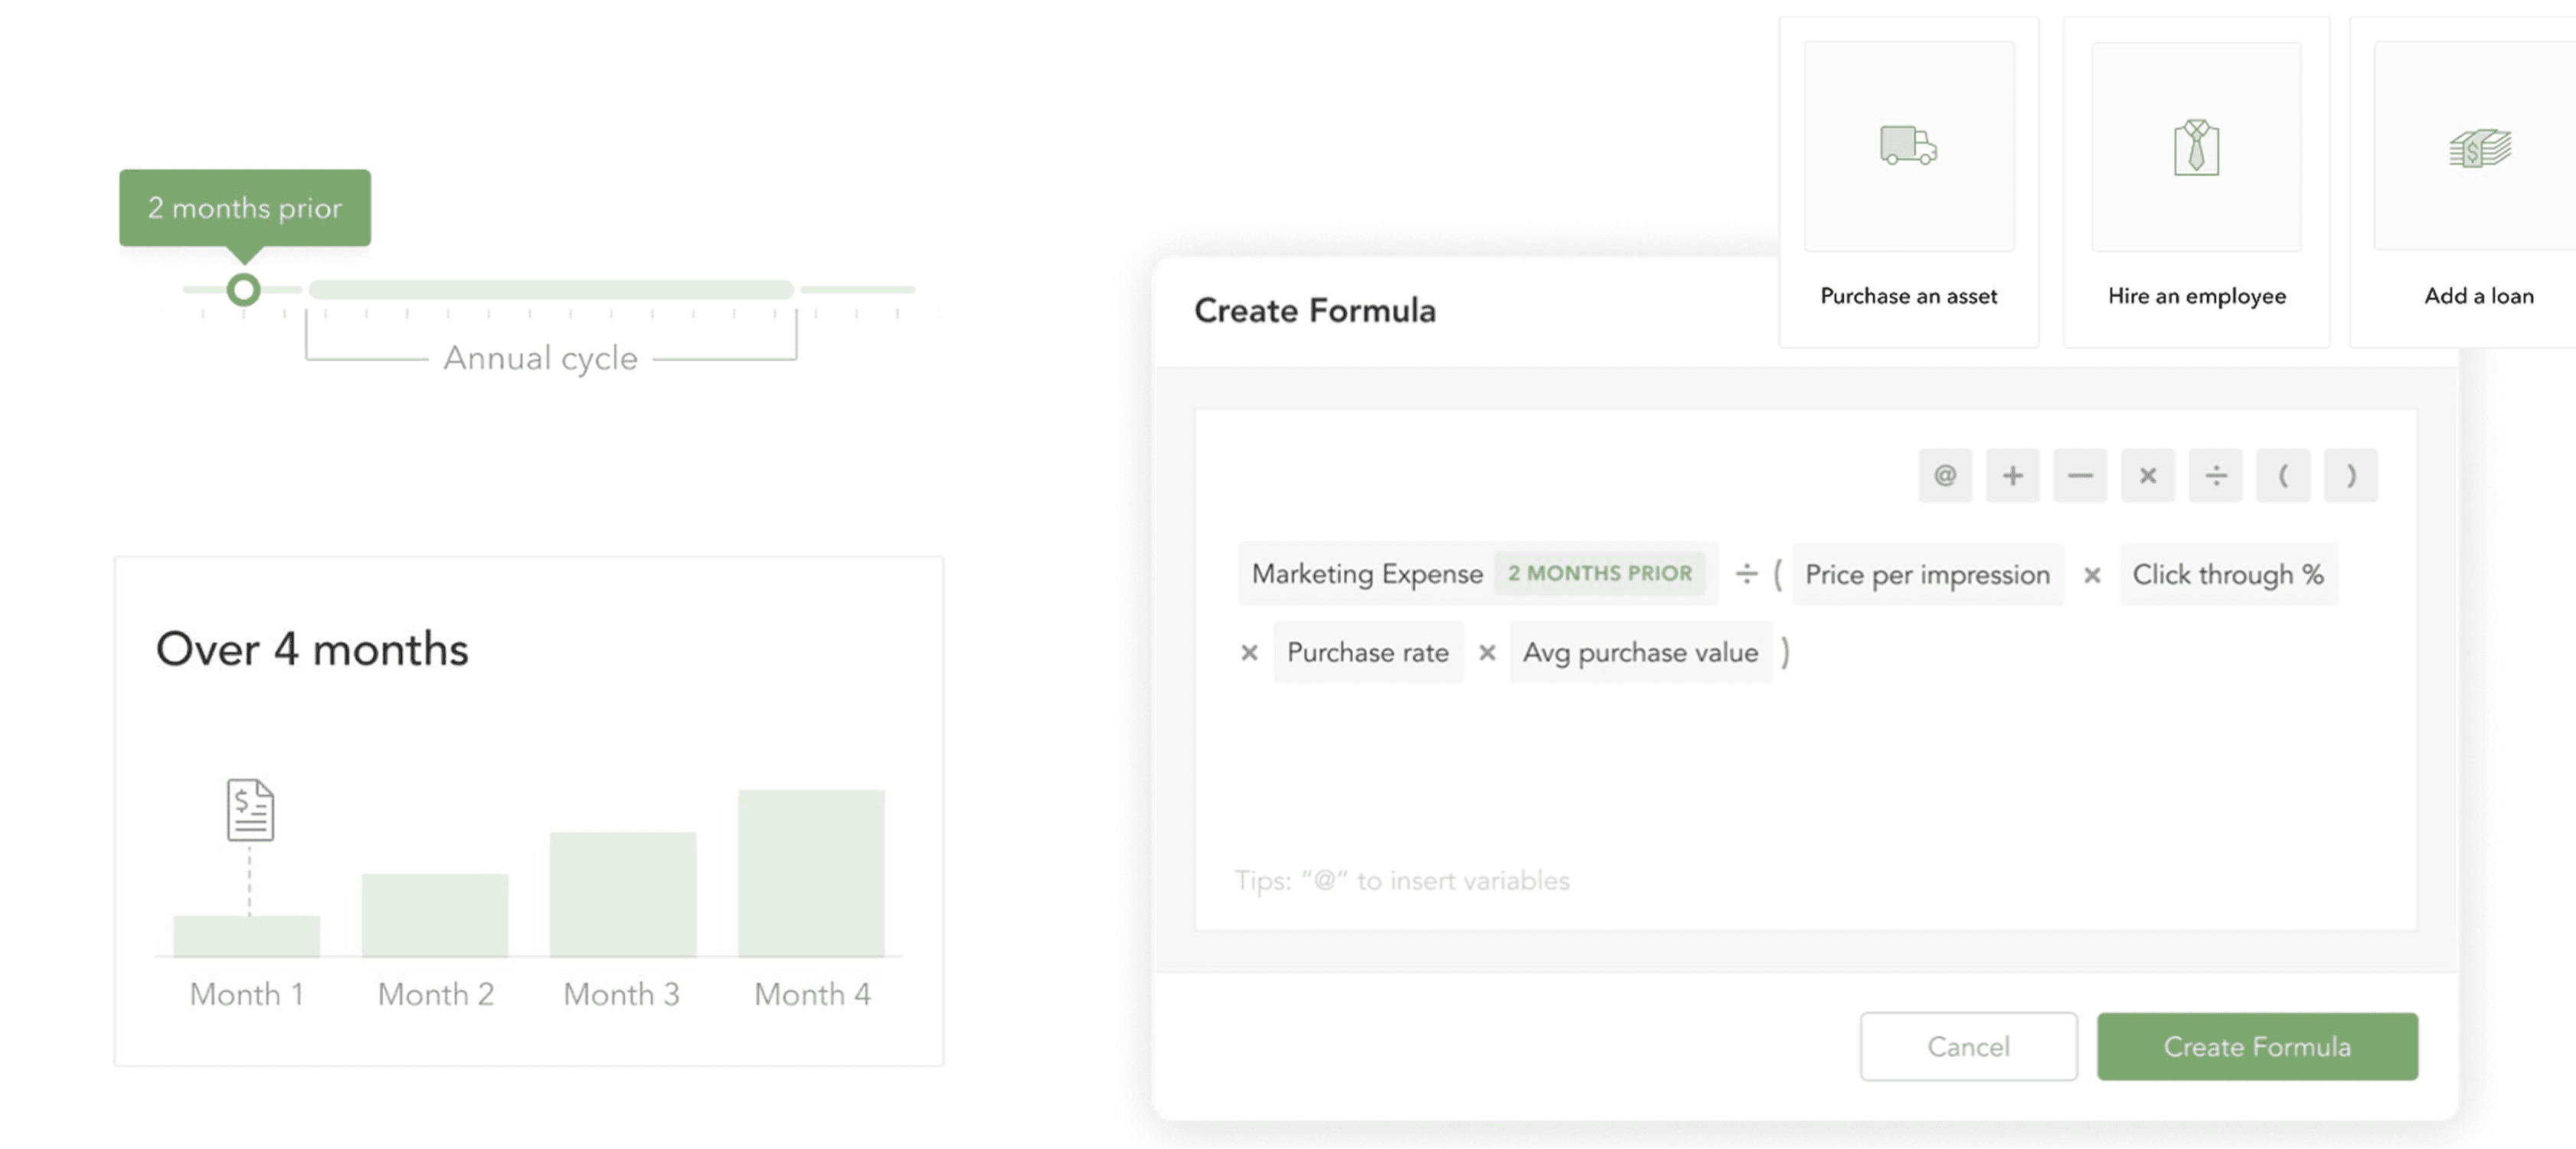
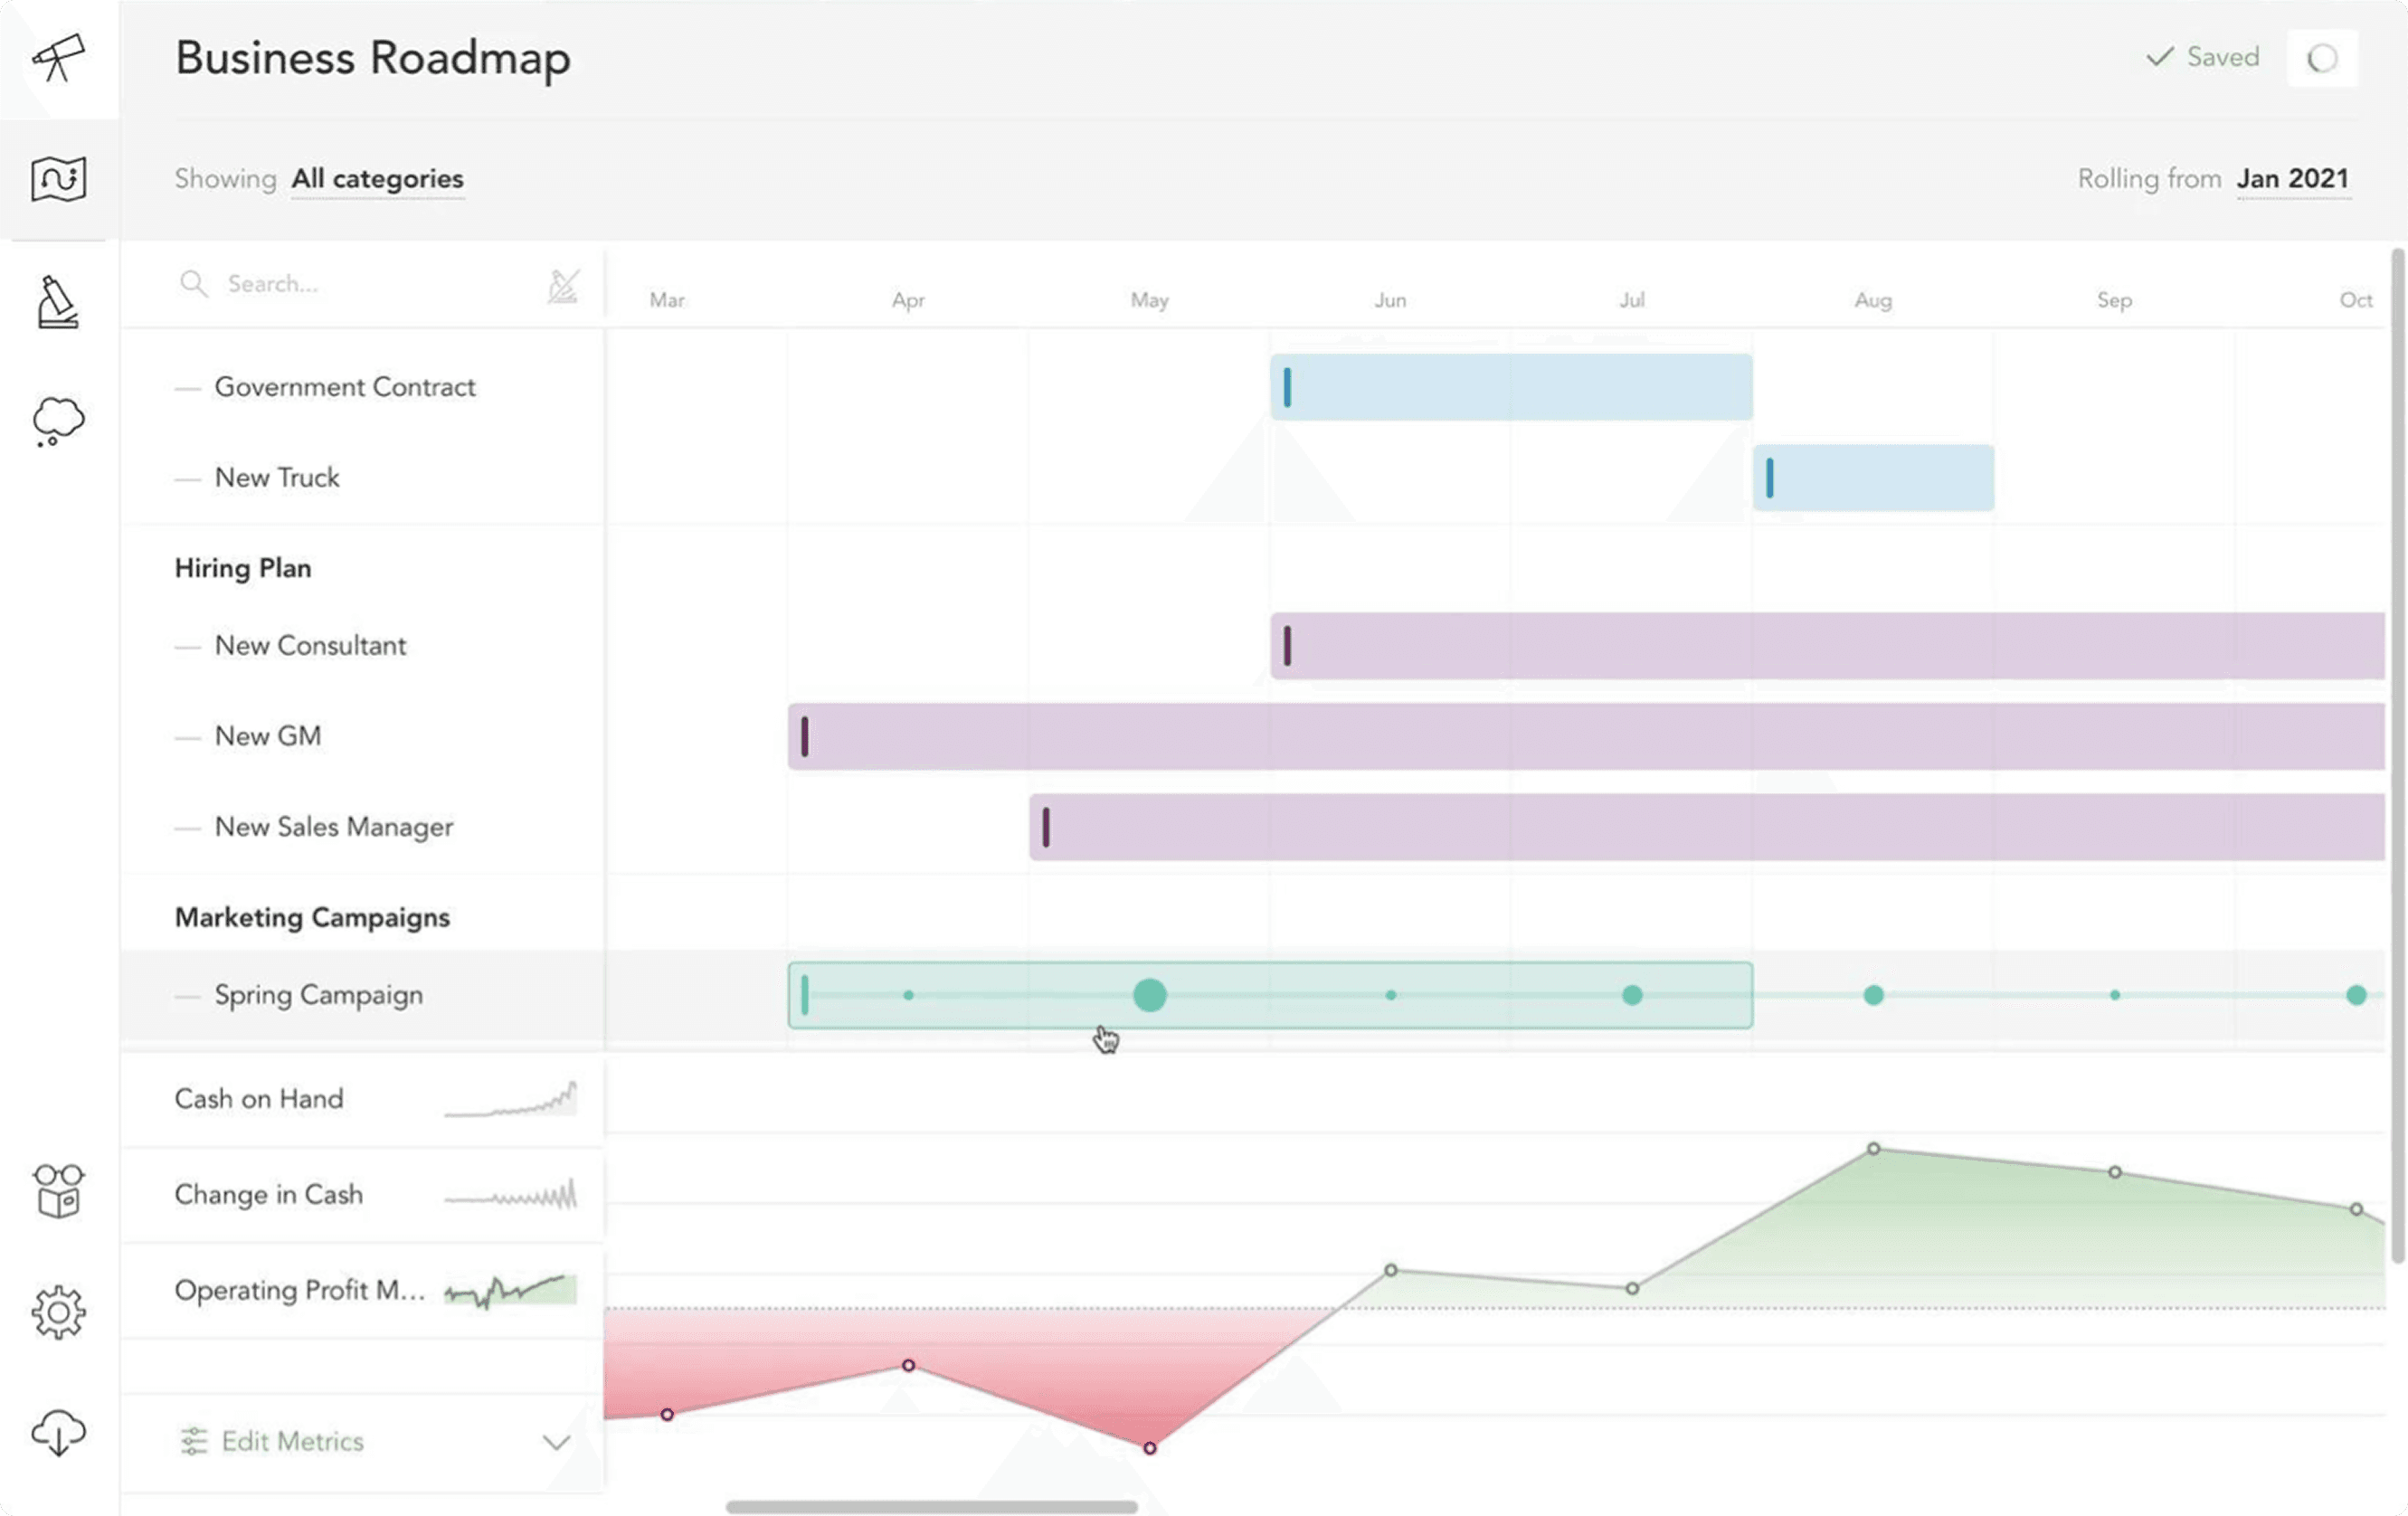
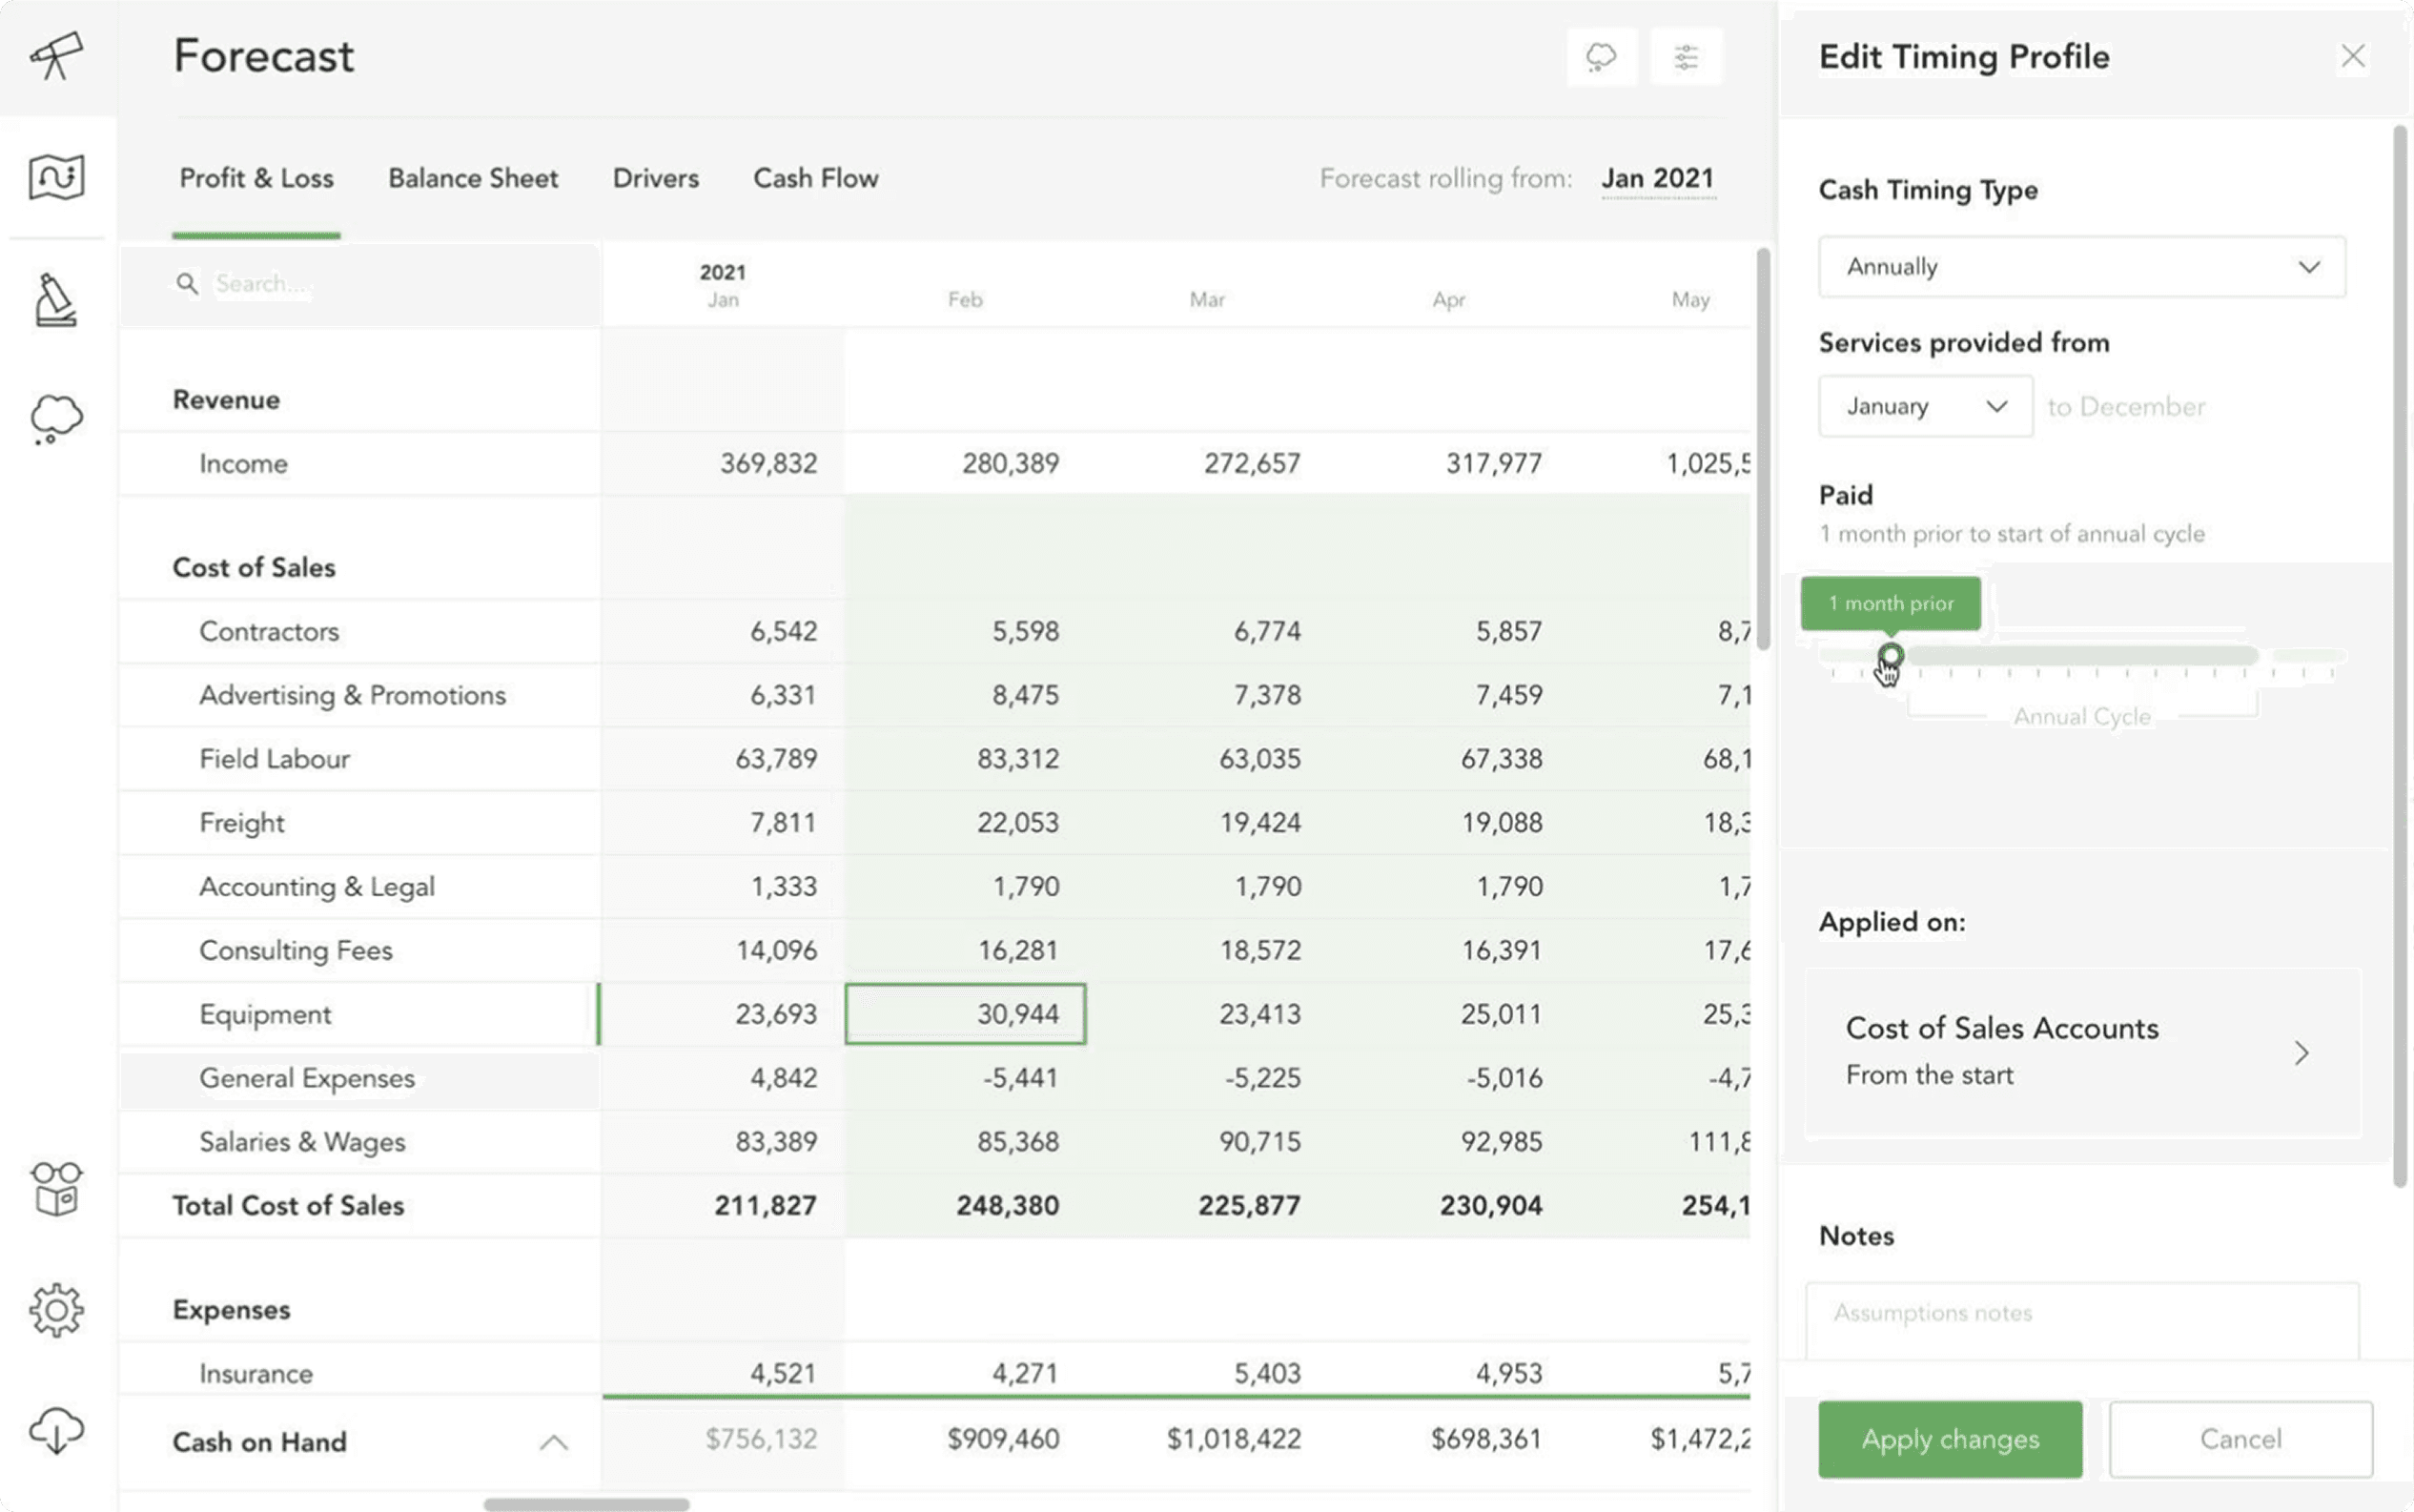
Microforecasts. Self-contained sets of P&L and Balance Sheet movements representing a single strategic initiative. Hire a sales manager, buy a truck, take out a loan. Each one a discrete object with its own assumptions and impact, easily plotted, edited, and removed without unpicking the entire forecast.
Business Roadmap. Microforecasts visualised on a familiar roadmap interface. If a small business owner could understand a project roadmap, they could understand a financial roadmap. We didn’t invent a new mental model. We borrowed an existing one and applied it to finance.
Cash at the forefront. Live cash position visible at all times, reactive to every decision big or small. Alerts when the projection went red. Cash flow is the single biggest killer of small businesses, so we made it impossible to lose sight of.
Scenarios. Branch off the main forecast to test possibilities without committing. Promote a scenario to the main forecast when ready.
Health Check. Monitoring layer that flagged where assumptions had drifted from reality and suggested where to focus attention. Most forecasts get built once and abandoned. We made the maintenance the easy part.
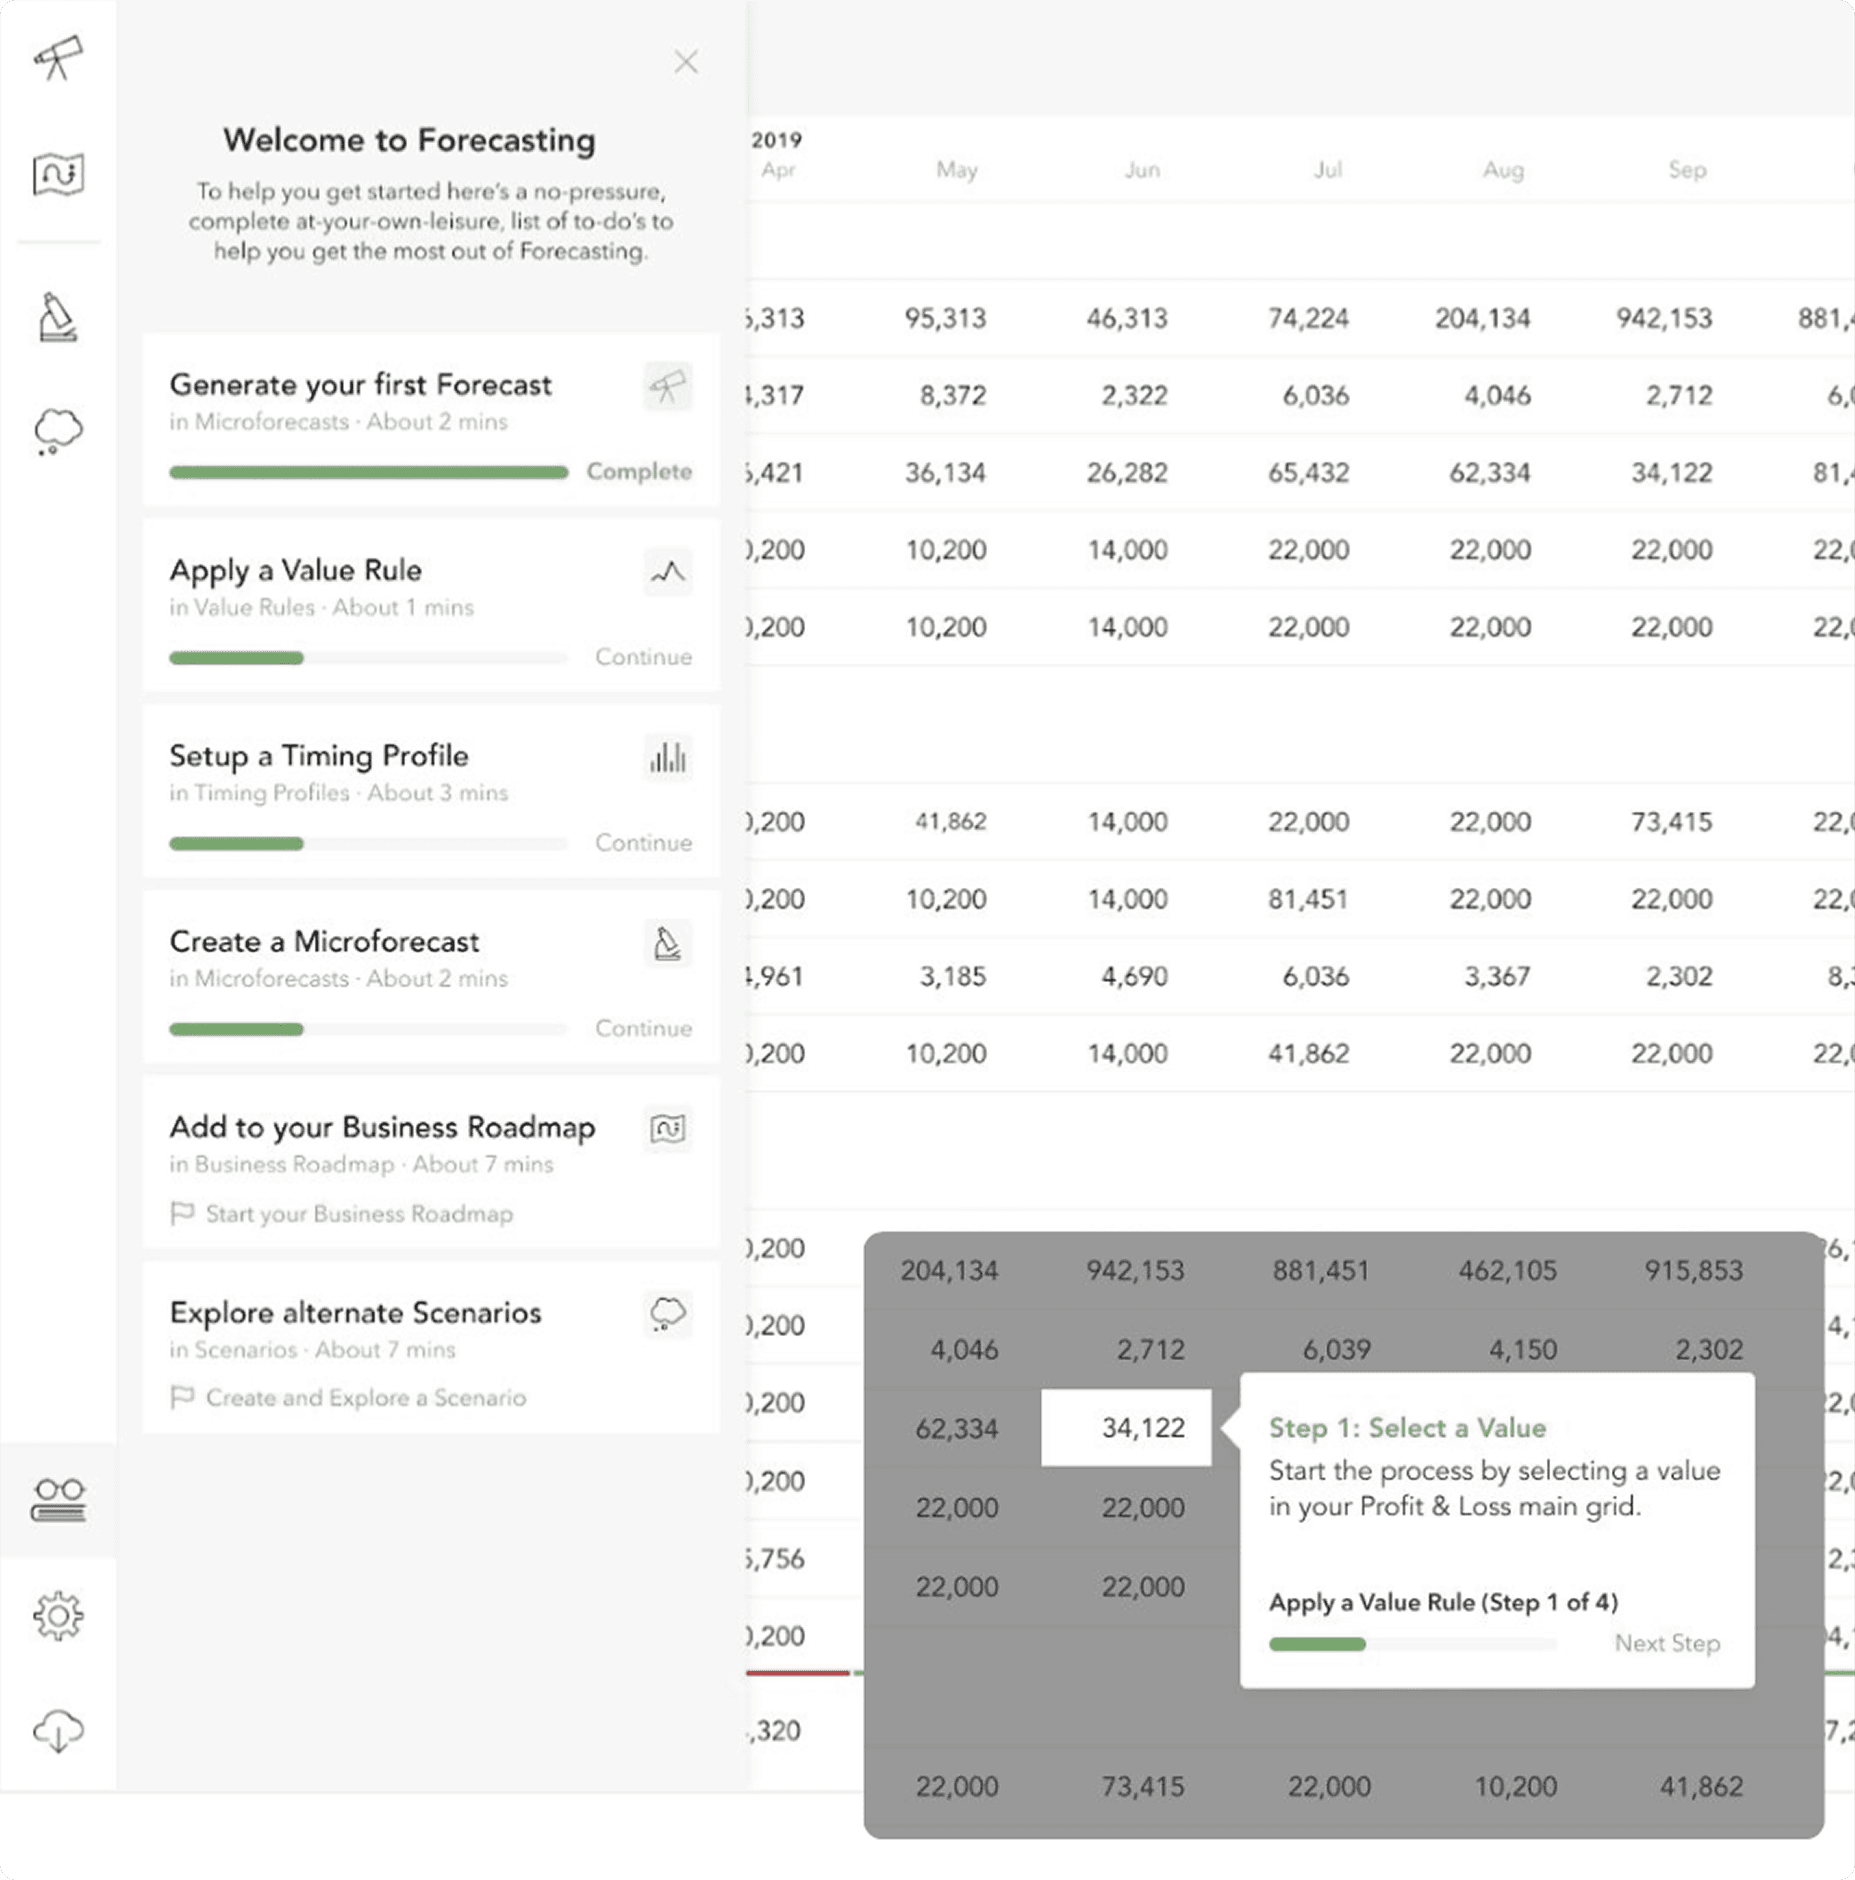
Progressive onboarding. Content-first, benefits-led, scripted and edited end-to-end, videos included. This one I owned on the design and production side: set up the small in-office studio for our customer success team to record in, wrote the scripts that explained the product to new users, and shaped the gamified progress-driven UI that stitched the videos and the text together. The intimidation around financial modelling was as much a barrier as the modelling itself, and we treated it that way.
What happened
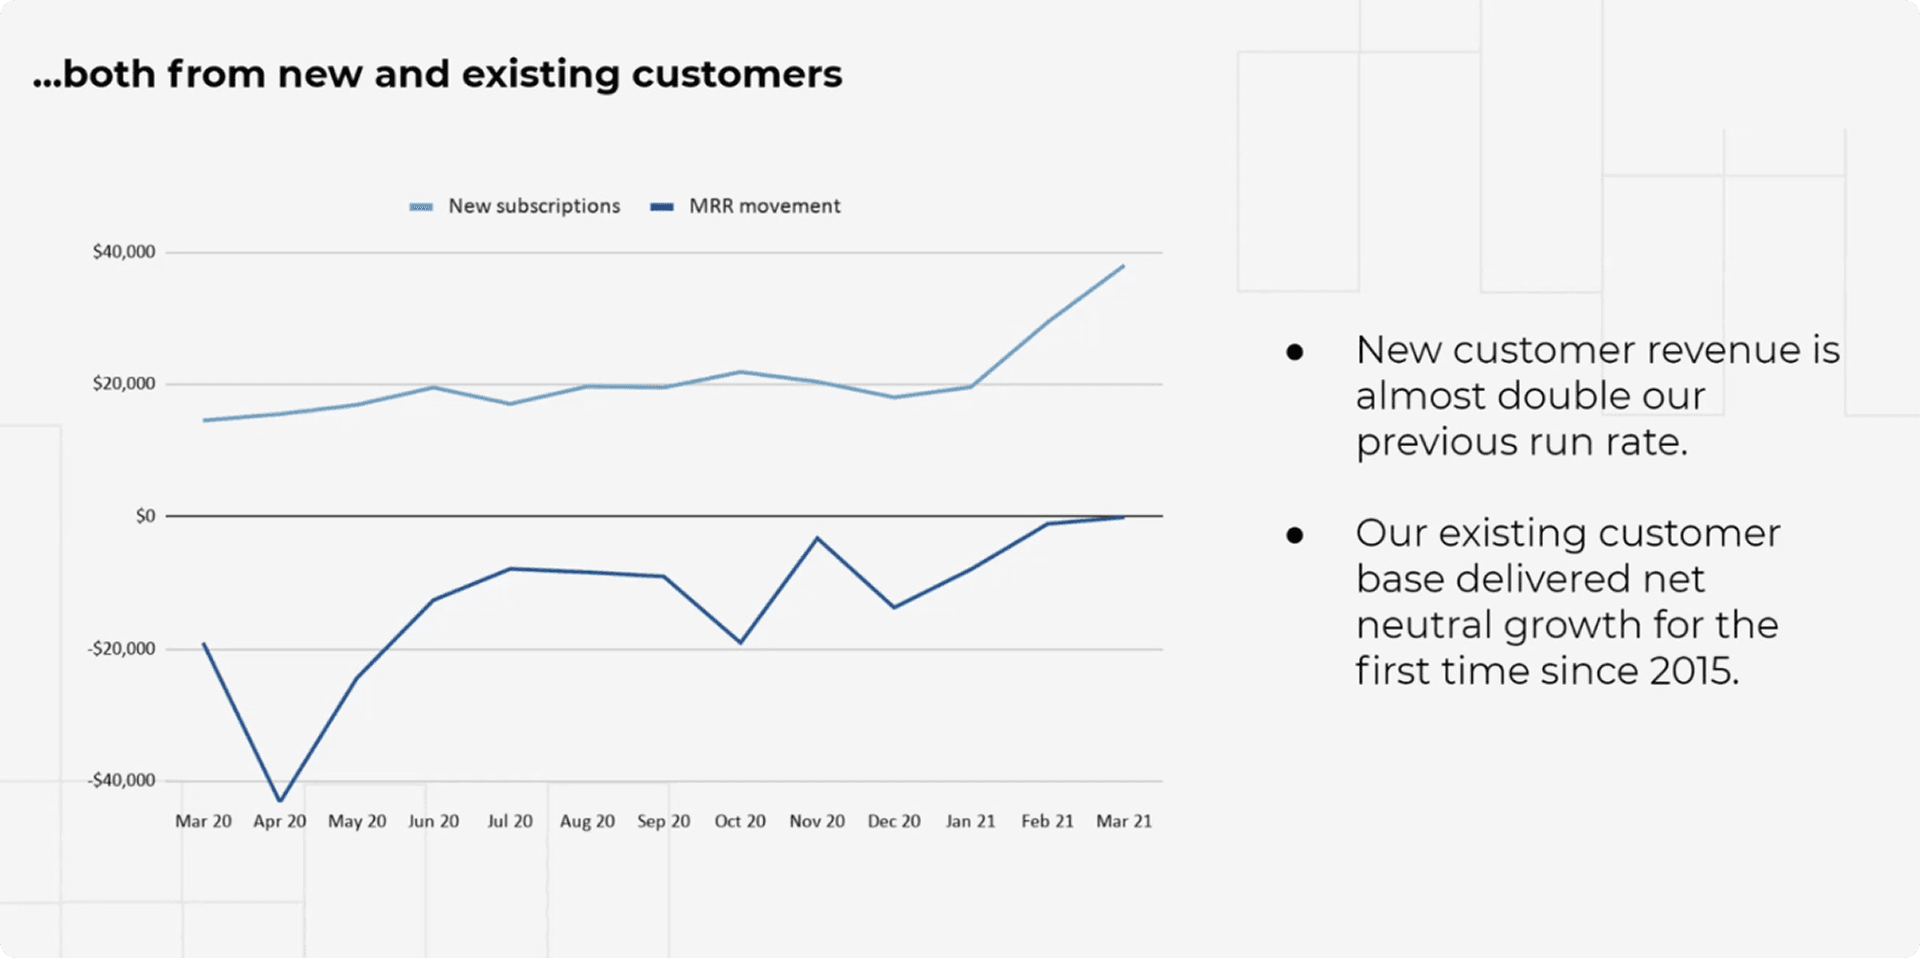
- 46% month-over-month increase in new customer revenue, directly attributable to the release
- $100k MRR added in Q1, representing 10% of the business
- New customer revenue almost doubled previous run rate
- 5,000+ forecasts created with minimal support load (under 15 support interactions per day)
- Patent filed for novel design innovations
- Existing customer base delivered net neutral growth for the first time since 2015
What customers said
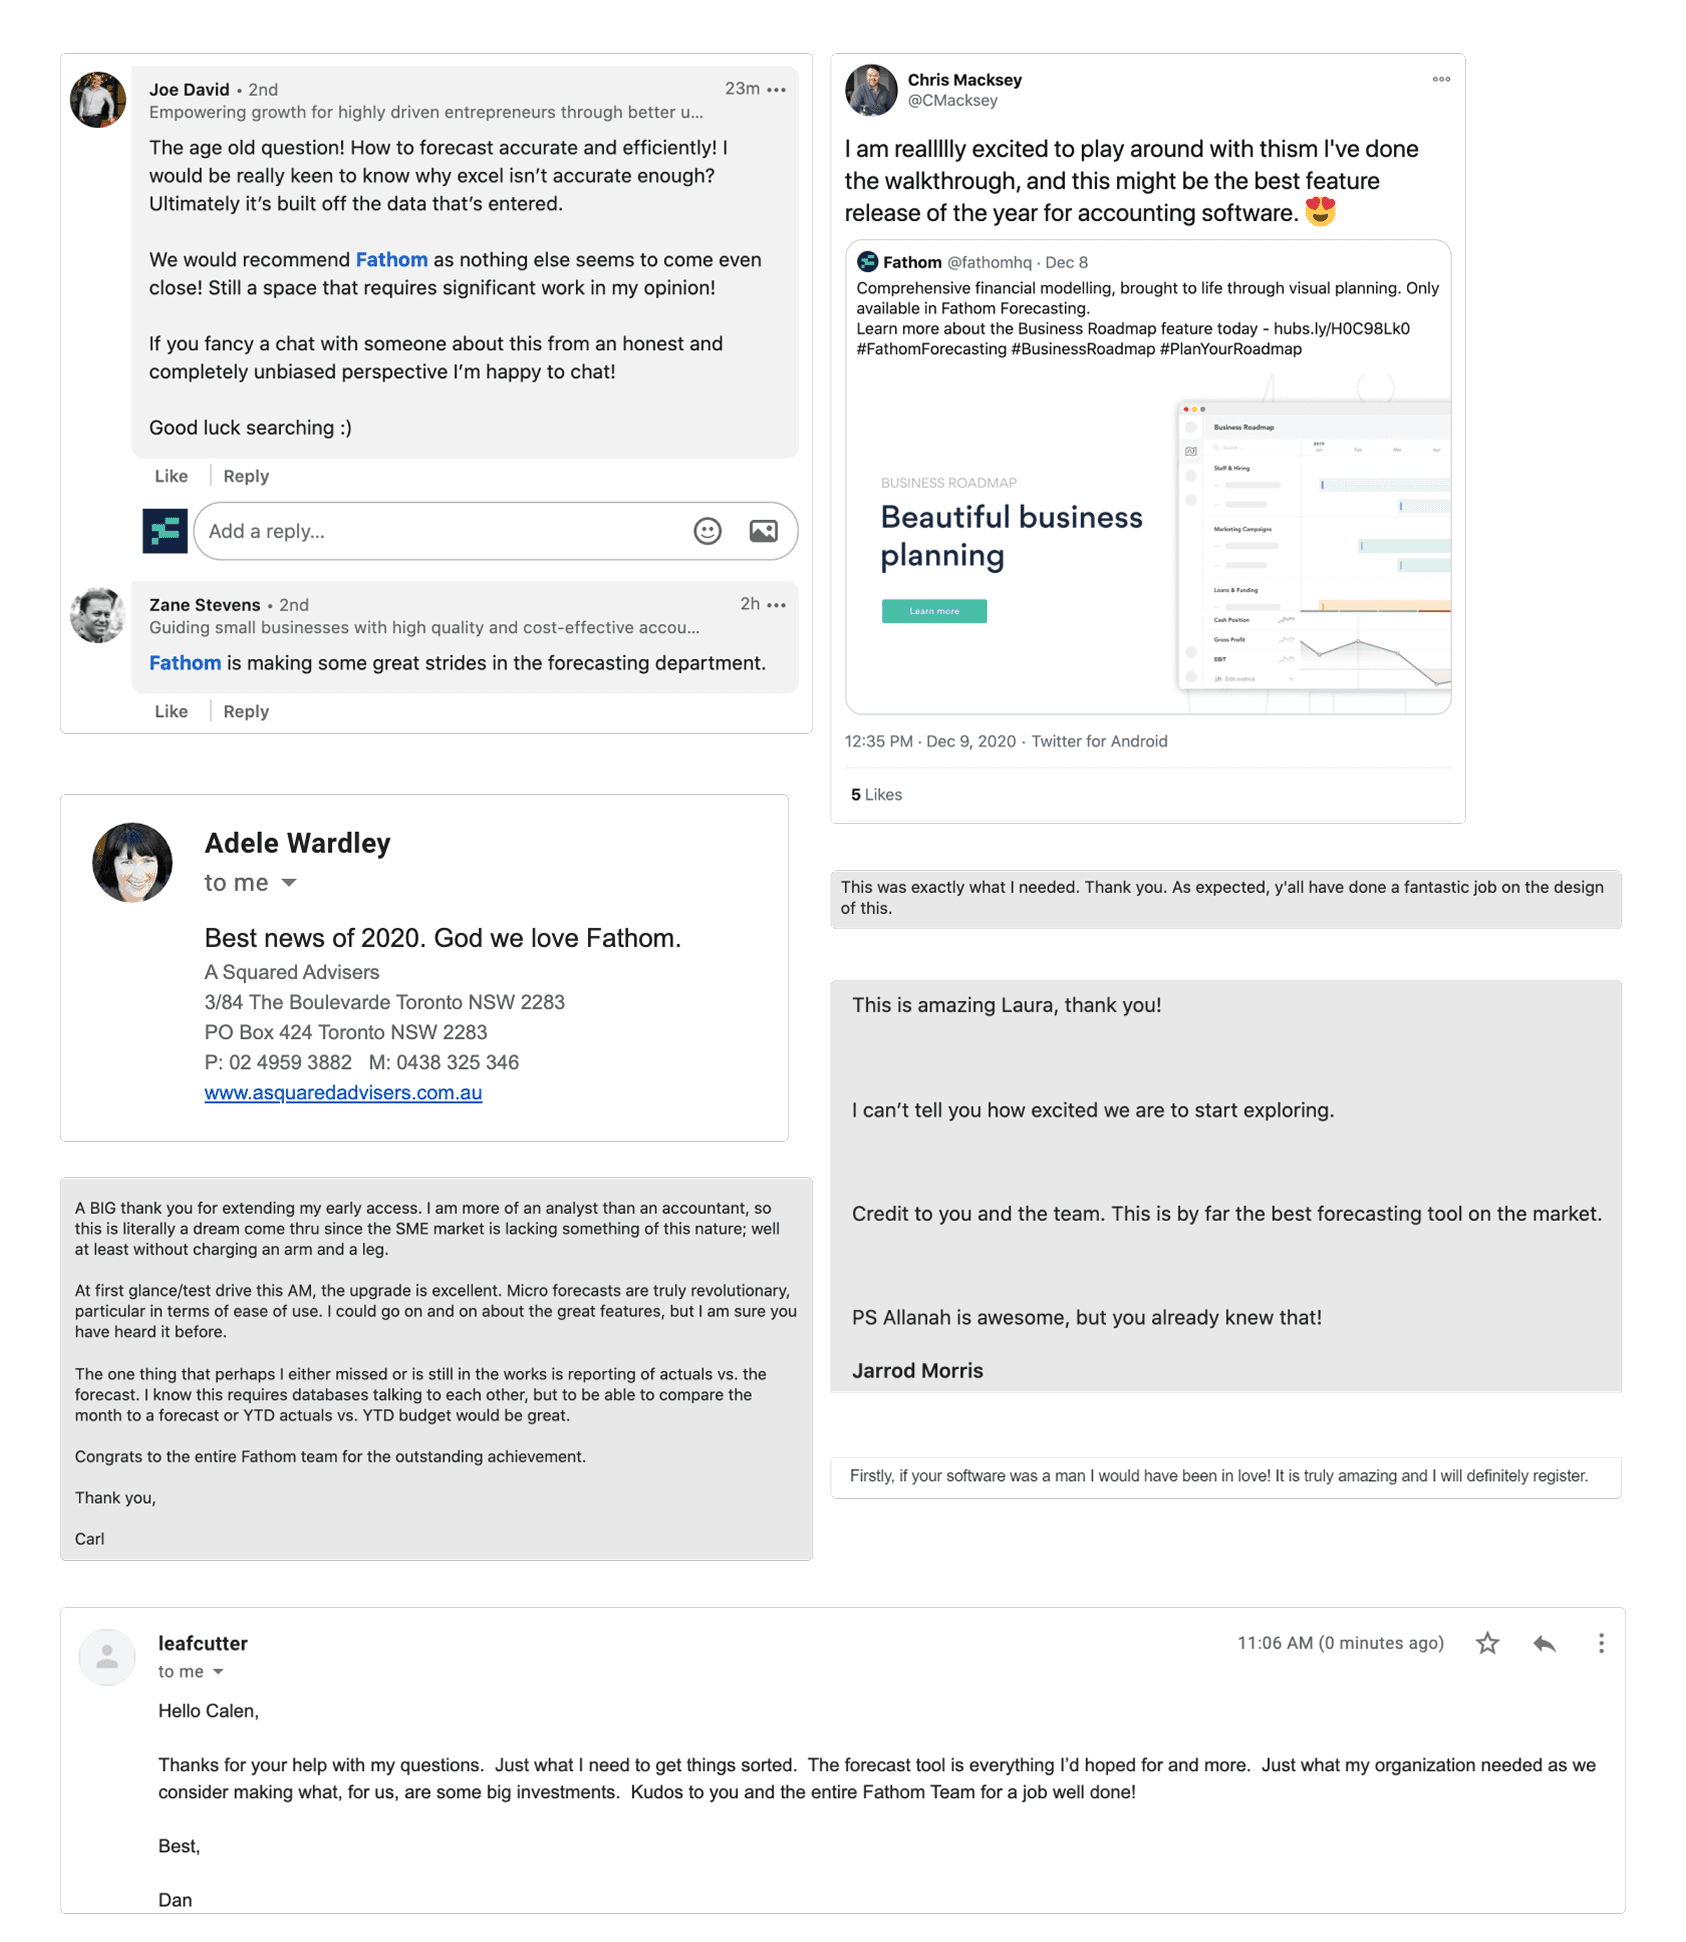
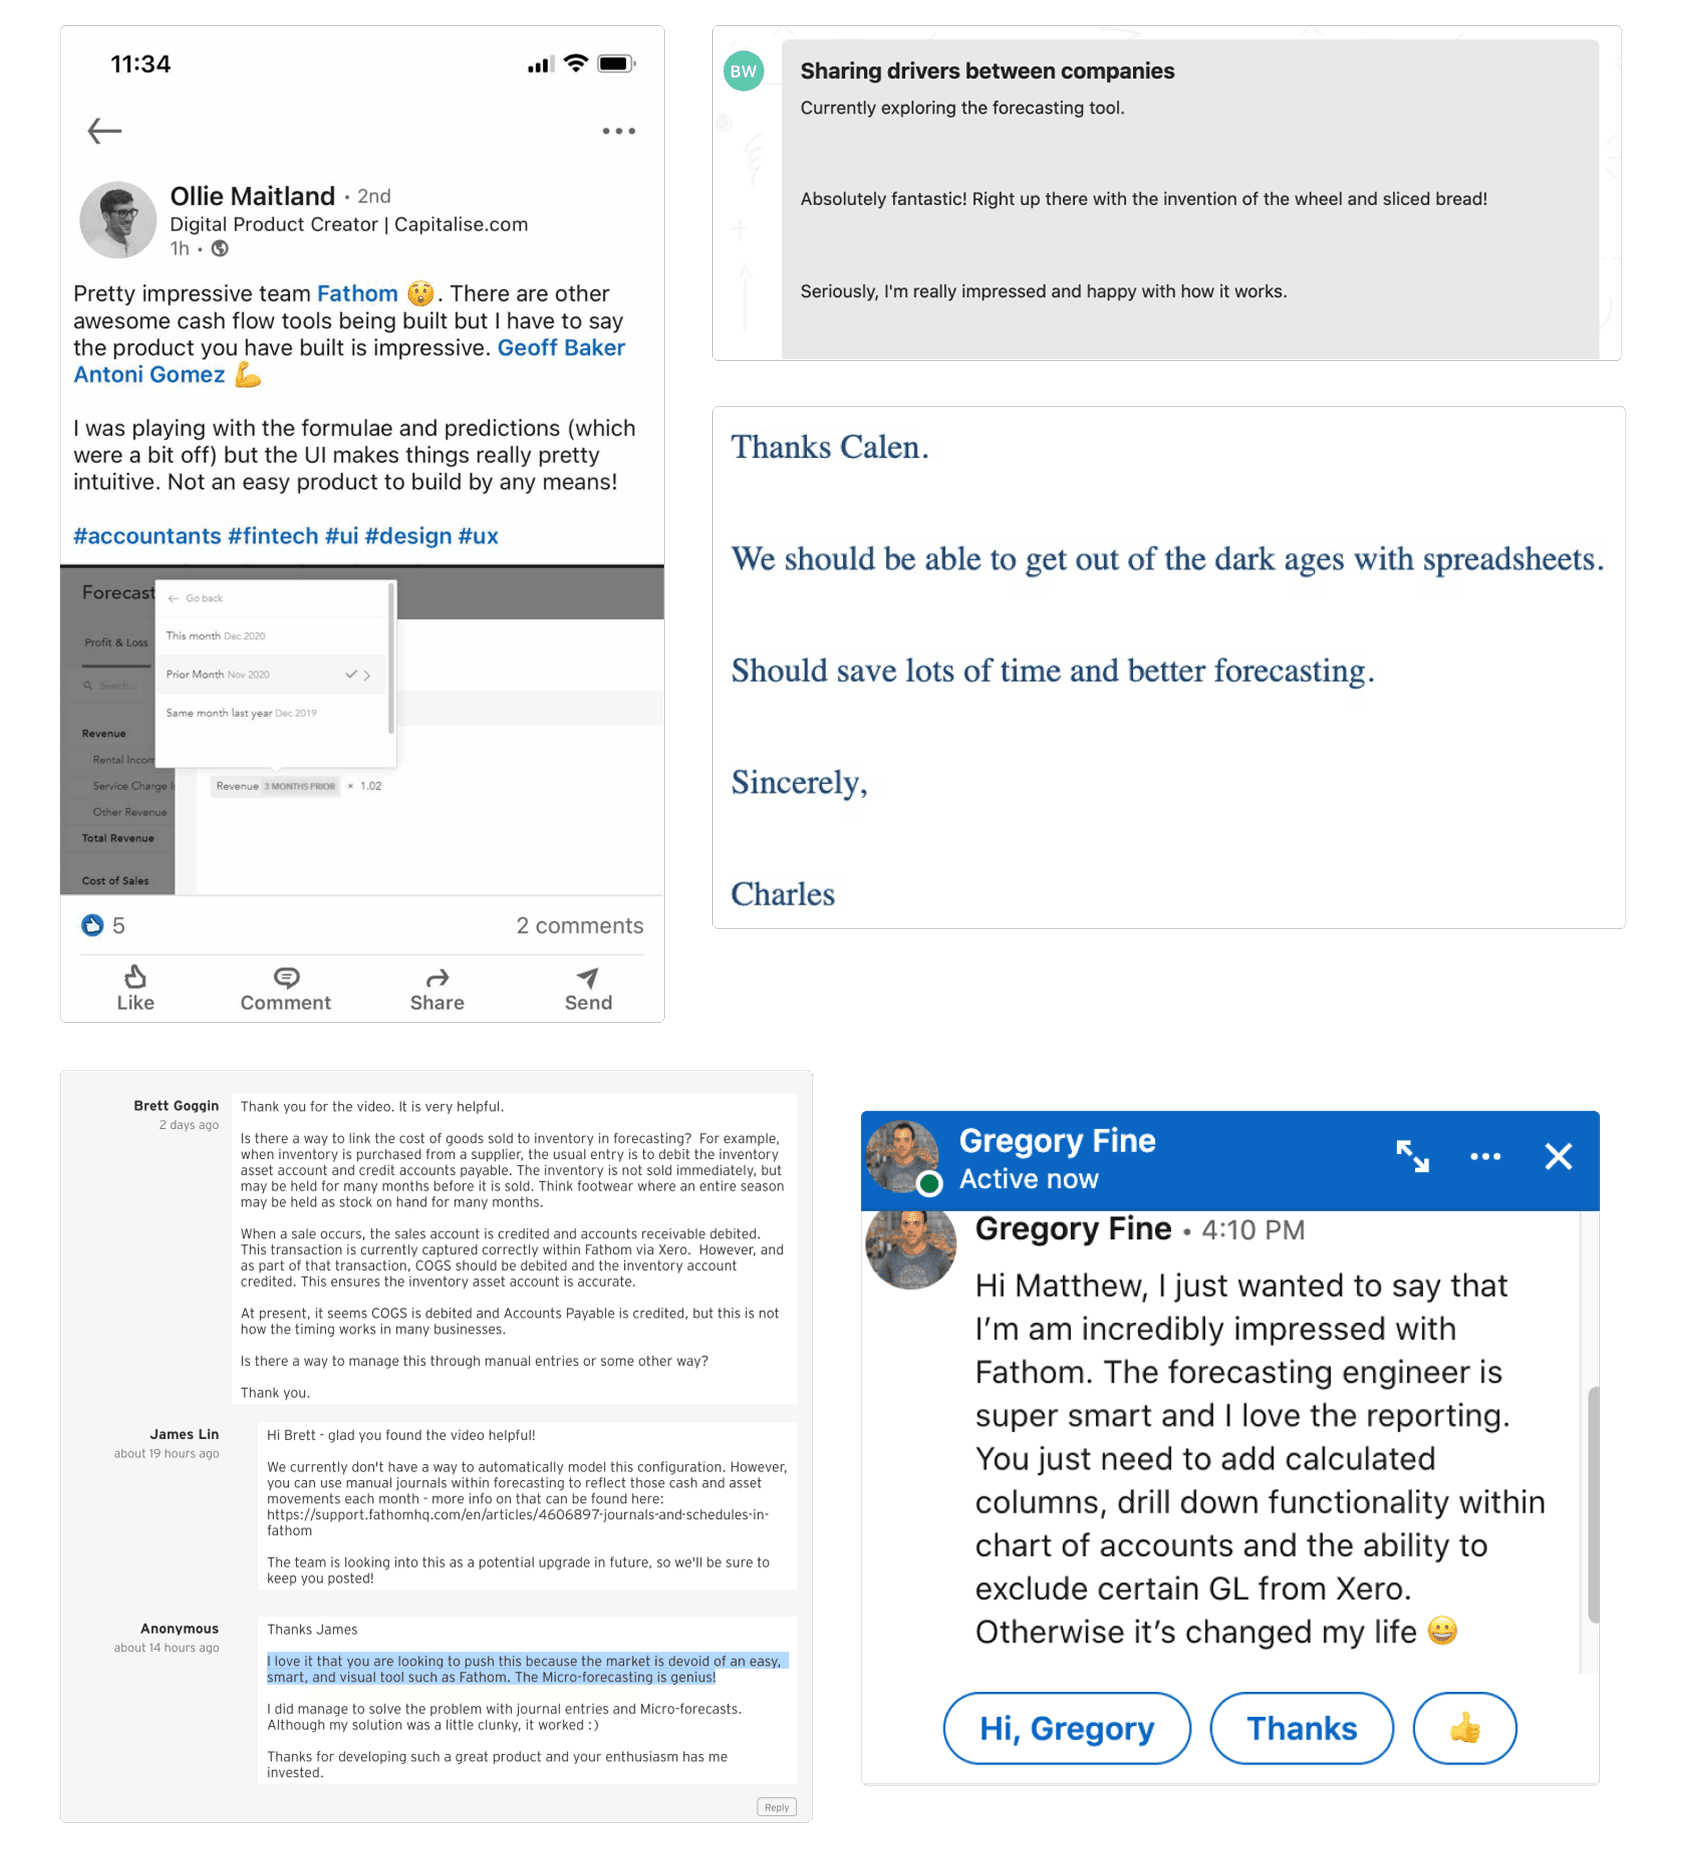
“I honestly think what you have built here is absolutely world class. It’s phenomenal to do something this simple and this well designed when it’s so complex. It’s rock and roll. A real game changer.”
Organisational outcomes
The product mattered. The pattern that came out of building it mattered more.
User research became a trusted method for decision-making across the company, not just a designer activity. Cross-functional collaboration improved measurably; product designers were now treated as strategic partners, not service providers. Product design was elevated to direct partnership with the founders on vision and strategy.
A team that hadn’t shipped a new product in seven years now had the muscle to do it again. That was the real outcome.
A team that hadn’t shipped a new product in seven years now had the muscle to do it again.
What I’d want someone to take away
The interesting design problem wasn’t the interface. The interesting problem was the seven years of organisational inertia that made the interface possible to ship at all, and a team that rotated mid-flight while still being expected to ship a category-defining product.
The thing that worked was slowing down at the start to align on what we were actually trying to do, and the team then earning permission to move quickly later by being right about it. My contribution was on the design craft inside that frame, the domain work to keep new team members productive fast, and the research phases the team ran together.
The Reporting replatform is on a separate page. I was Senior Product Designer on it, start to finish.
If you're reading this and you worked on Forecasting too, hi. The work was good.
The interesting design problem wasn’t the interface. It was the seven years of organisational inertia that made the interface possible to ship at all.